Visualizing and Reflecting on Your Results
In this activity, you'll see what other questions you can explore about your investigation topic, create a visualization, and reflect on your results.
Asking Additional Questions
- Review what you have learned about your investigation and see if you can generate any other interesting questions to explore using the functions you've explored Snap!.
- Open your "Data Dos" project if it isn't open already. Then answer your additional questions using Snap!.
Importing Blocks from Another Project
In Snap!, you can use blocks that you've created in previous projects. For example, these data visualization tools from your first data project might be useful:
-
The
 block counts the number of times each word appears in a list. You can use it to count the number of each type (category) of response to a question.

-
The
 block orders values from largest to smallest, smallest to largest values, or alphabetically.

-
The
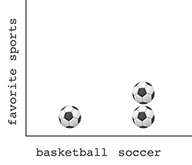
 block takes an emoji, title, and list of category counts as input and draws a pictograph of the category count data using the emoji as the picture and putting the title on the vertical axis.


To use blocks from another project, you must first export them from the project where you built them and then import them into your current project.
-
 Export the blocks from your previous project.
- Save any changes to your "Data Dos" project, and open your "Visualizing Data" project.
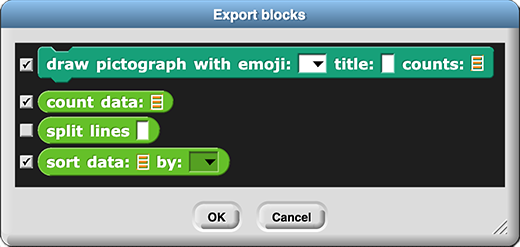
- Choose "Export blocks..." from the Snap! file menu (
 ).
).
- Deselect any block(s) you don't need such as the
split lines block.
- Click "OK." An XML file will download to your computer.
-
Import these blocks into your current project.
- Open your "Data Dos" project again.
- Drag the XML file that downloaded into the Snap! window to import it.
If you see a message when you try to import that asks "Replace the current project with a new one?" it means that you exported a whole project instead of just its blocks. Click "No," and try exporting from "Data Dos" again.
Is it still possible to get the obsolete block??
It won't happen here, but if you ever see  inside an imported block, it means a required block is missing. Delete the imported block, open the original project, and export again selecting all the blocks used inside the block you want.
-
Select a survey question for your pictograph, and use
count data together with draw pictograph to create your visualization.
If your my survey watcher is in the way of your pictograph, you can move it, shrink it by dragging its lower right corner, or hide it by deselecting its checkbox in the palette on the left of the Snap! window.
 Is there anything new that you notice looking at your data in this format?
Reflecting on Your Results
-

- What did you learn about your research topic?
- Who might benefit from this information?
- What other questions did your research raise about this topic?
- How would your analysis change if you could survey 10,000 people with these questions?
- What other Snap! tools could you build that would be helpful to research?
- What other kinds of graphs would help visualize your data?
- What other topics would you like to research in the future?
Should we have them produce some kind of report/artifact here? (Per "2-IC-22: Collaborate with many contributors through... surveys when creating a computational artifact.") --MF, 3/1/22
In this activity, you expanded your data investigation by asking additional questions, imported visualization tools from your prior data project, and discussed possible extensions to your research.
 block counts the number of times each word appears in a list. You can use it to count the number of each type (category) of response to a question.
 block orders values from largest to smallest, smallest to largest values, or alphabetically.
 block takes an emoji, title, and list of category counts as input and draws a pictograph of the category count data using the emoji as the picture and putting the title on the vertical axis.

 Export the blocks from your previous project.
 ).
). inside an imported block, it means a required block is missing. Delete the imported block, open the original project, and export again selecting all the blocks used inside the block you want.