For the oscilloscope, the horizontal axis showed time, and the vertical axis showed volume intensity (loudness).
In a spectrum analyzer, the horizontal axis shows frequency, and the vertical axis still shows volume intensity.
Want to know more about frequency?
Frequency is how often a repeating sound pressure wave repeats. Music (when its more than just percussion) is about playing different frequencies in a way that people enjoy hearing.
microphone block by changing its input and clicking the block several times. (Try it both while you are making noise and while you aren't.).png)
Selecting the samples option from the microphone block makes it report a list of current microphone volume values sampled across a small period of time. Since reports the volumes set of samples over time, you used it to build your oscilloscope.
-reporting.png)
Selecting the spectrum option from the microphone block makes it report a list of current microphone volume values across a range of frequencies. Since it reports the volumes of a spectrum of frequencies, you'll use it to build a spectrum analyzer.
-reporting.png)
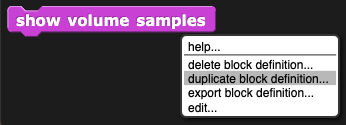
show volume samples block in the palette on the left, right-click it, and select "duplicate block definition..."
show volume samples (2).
show frequencies by clicking on the name of the block in the Block Editor window and changing or deleting the text in the title. block with these critical changes:
for each block should be microphone (spectrum) instead of microphone (samples) so that it draws the intensity for each frequency in the spectrum instead of the intensity at each sample over time.for each block should be frequency instead of volume sample. Be sure to change the variable in the y input for the go to block also.
go to block doesn't need to be scaled up by multiplying by 150, but the value could be lowered (using subtraction) so that the drawing starts near the bottom of the stage (for example, you might subtract 150 instead).
 ) to a similar block (like
  ), right-click the block, and choose "relabel..."
show volume samples block with the show frequencies inside the forever block, and test your code. Make some noise, watch the results, and work with your partner and classmates to debug any issues. The spectrum analyzer should look something like this: